Diazovate
Custom dashboards & automation for your business
Available for projects

Eliminate spreadsheet chaos. See what matters at a glance.

In 14 days I stabilize your process, automate the handoffs, and deliver a simple, reliable dashboard your team trusts. Minimal disruption: dashboards layer over your current Google Sheets.
  • See cash in/out and what's overdue without hunting through files
  • Spot which locations/products need attention first
  • Cut repetitive updates with lightweight automations
Book a 30‑minute call
Based in NYC, working remotely with clients anywhere.
Efficiency gain
40% fewer manual updates
Automations reduce repetitive spreadsheet work.
Faster reviews
2.4× quicker weekly reviews
Decision‑ready views show trends and bottlenecks instantly.

What I build

Custom dashboards and lightweight tools that sit on top of the data you already have.

I clean up fragile spreadsheets and ship dashboards your team can actually run the business from.

The result is a simple, decision‑ready view you can run the business from.

I typically build:

  • Invoice & payment dashboards — see who owes what and what's overdue at a glance
  • Operations performance views — weekly snapshots and rankings for faster reviews
  • Inventory / logistics dashboards — delivery windows and risk flags surfaced early
  • Simple internal tools — plug into your existing spreadsheets with minimal disruption

Live examples

A few representative tools and dashboards I’ve built. Each one can be adapted to a different business, industry, or workflow.

Finance / cashflow
Invoice & payment tracker

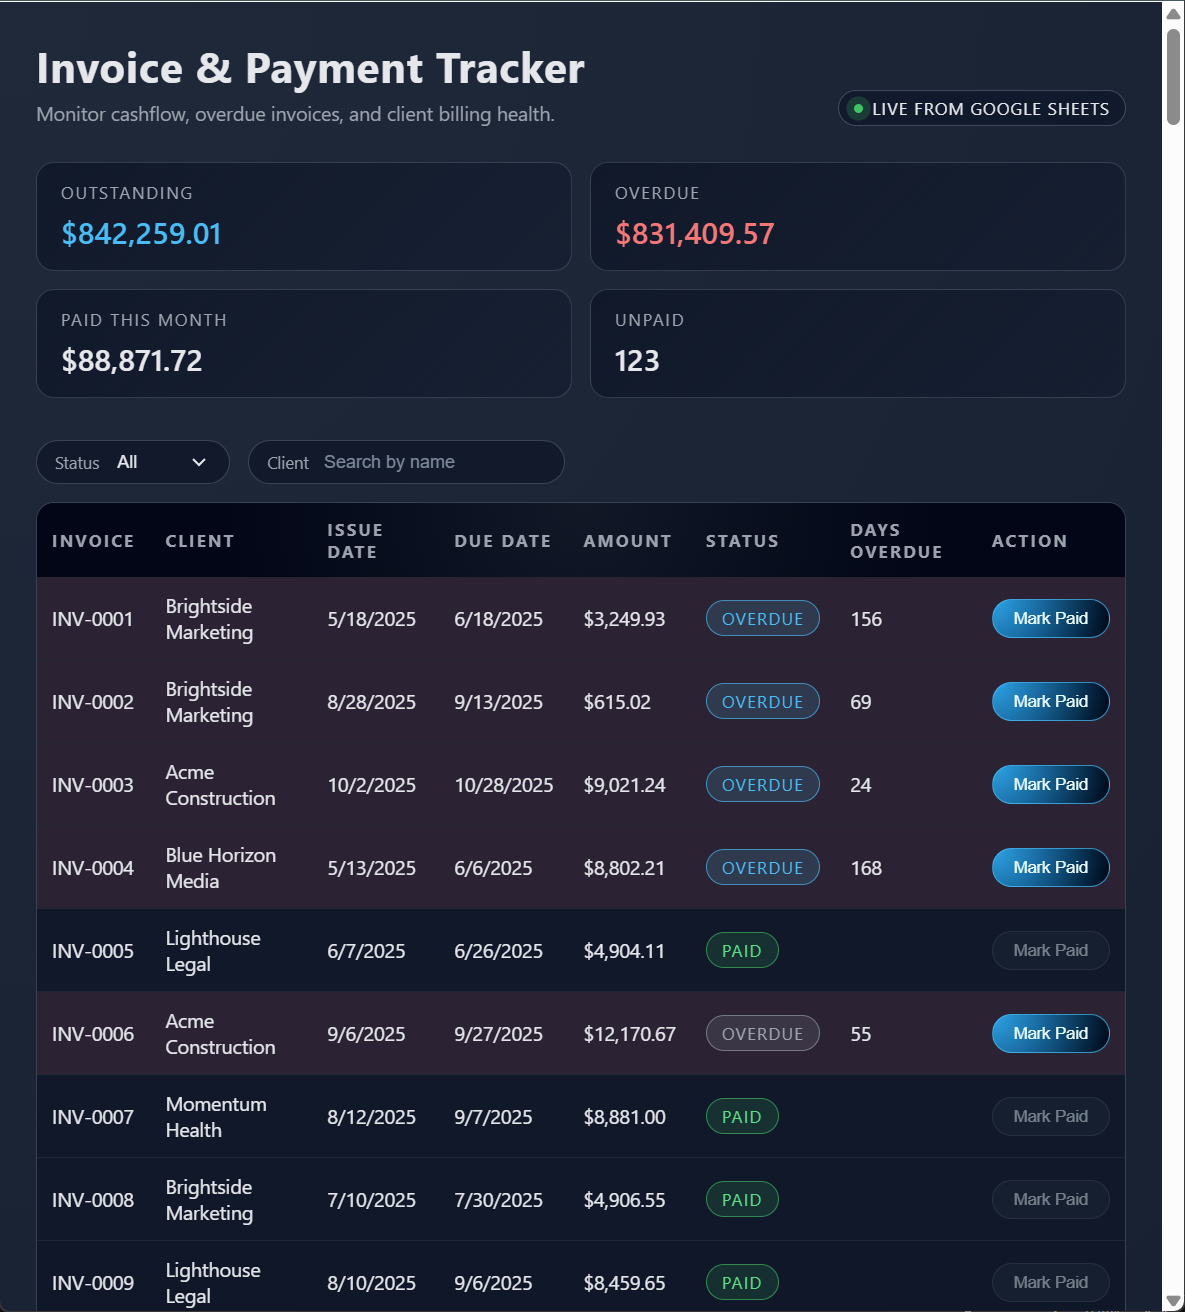
Shows open, paid, and overdue invoices in one place. You can filter by client or status, see what was paid this month, and mark invoices as paid directly from the dashboard instead of scrolling through rows.

Who it's for: owners or bookkeepers who need a clean receivables view.

Works with your existing Google Sheets. No ERP change required.

Operations
Regional performance dashboard

Multi-metric performance view with weekly snapshots, rankings, and movement over time. Built to replace static reports and make it easier for leaders to see which locations are improving, slipping, or need support at a glance.

Who it's for: operations leaders who want faster weekly reviews across regions.

Minimal disruption: layers over your current Sheets and reporting.

Inventory / logistics
Inventory health & fulfillment

An inventory management-style dashboard showing outstanding orders, delivery windows, and risk flags. Helps operations teams spot issues early, reduce stockouts, and keep an eye on what's coming in without digging through multiple spreadsheets.

Who it's for: inventory/logistics teams that need proactive risk flags and windows.

How I work

Simple, transparent process designed to move from “messy spreadsheets” to a usable system in a few weeks, without you needing to learn any new tools.

Step 1
Quick call
You show me your current spreadsheets and talk through what's painful or confusing about them today. Plain English is perfect, no technical prep needed.
No technical prep. Show me the messy sheet as‑is.
Step 2
Design & plan
I map out how your data should flow and outline 1–2 dashboards or tools that would give you the clearest view with the least maintenance and manual work.
Step 3
Build
I build the dashboards, connect them to your data, and test them using your real workflow and edge cases so they feel natural to use day to day.
Step 4
Handoff & support
You get a walkthrough, simple documentation, and support while you roll it out and start using it with your team.

Typical project sizes

Every project is scoped individually, but most work falls into one of these buckets.

Foundation dashboard
Clear insights for one part of your business.
Typical range: $3,000–$5,000
  • One custom dashboard (performance, finance, inventory, or ops)
  • Light cleanup of your existing sheets
  • Key KPIs + simple filters
  • Connects to your current spreadsheets
  • Walkthrough video + short documentation
Core operations dashboard
For teams with messy spreadsheets or manual reporting.
Typical range: $4,000–$7,000
  • One advanced dashboard with multiple subviews
  • Significant data cleanup + restructuring
  • Automated calculations + standardization
  • Alerts and workflow triggers where useful
  • Rollout support + collaborative reviews
Integrated operations suite
For businesses needing connected dashboards + automation.
Typical range: $6,000–$15,000+
  • 3–5 interconnected dashboards (inventory, ops, finance, HR, forecasting, etc.)
  • Full data normalization across sheets and processes
  • Automated alerts, logic, and workflows
  • Documentation + onboarding/trainings
  • Optional retainer for ongoing improvements
Month‑End Audit
Clarity first. Scope the fixes with a quick win.
Typical range: $1,500–$3,000 • 5–10 days
  • Findings + prioritized fix list
  • One quick‑win automation
  • Implementation plan with timeline and cost

About & contact

I've spent years working in operations, process design, and continuous improvement. A common pattern across roles has been cleaning up messy spreadsheets and building tools that help teams see what's happening and act faster.

Ops background across fast‑moving teams; specialized in stabilizing messy spreadsheet systems and shipping decision‑ready views in 14 days.

If you're a business owner or operations leader who knows you're under-using the data you already have, I can help you turn it into a clear, reliable view you can actually run the business from, without adding another complex system to your stack.

If you’d like to explore a project, the easiest next step is either a short intake form or a quick call where you show me what you’re using today and what’s not working.

In your message, feel free to include a short description of your current setup (what you’re tracking, what tools you use now, and what you wish you could see more clearly). Plain English is perfect.